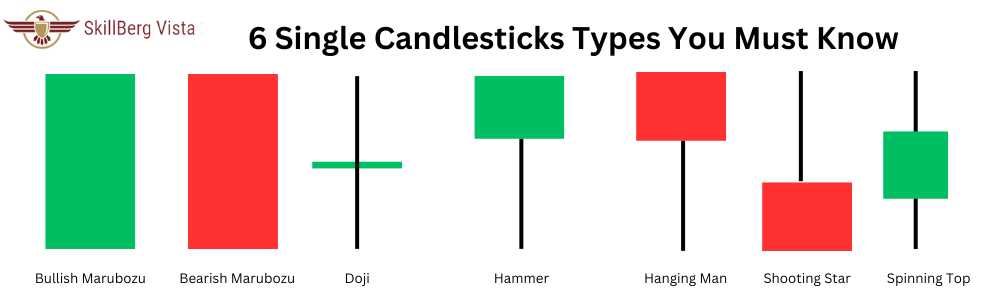
Double candle stick patterns are chart patterns formed by two consecutive candlesticks on a price chart. These patterns are often used in technical analysis to help traders identify potential trend reversals or continuation patterns. Here are some common types of double candlestick patterns:
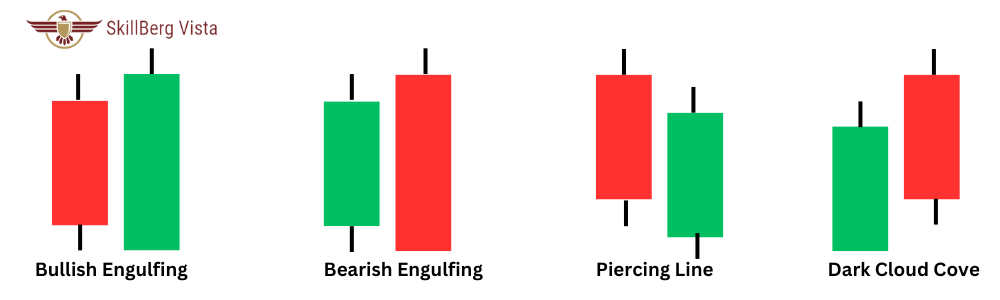
- 1. Bullish Engulfing Pattern:
- Explanation: This pattern involves two successive candlesticks on a price chart. The initial candlestick is bearish (down), followed by a larger bullish (up) candle that completely engulfs the preceding bearish candle.
- Interpretation: This formation suggests a potential reversal in favor of bullish market sentiment.
- Trend: It should be downtrend
- 2. Bearish Engulfing Pattern:
- Explanation: This pattern consists of two consecutive candlesticks. The first is a bullish (up) candle, succeeded by a larger bearish (down) candle that engulfs the previous bullish candle entirely.
- Interpretation: This pattern signals a potential reversal in favor of bearish market sentiment.
- Trend: It should be uptrend
- 3. Piercing Line Pattern:
- Explanation: This pattern involves two consecutive candlesticks. The initial candlestick is bearish, followed by a bullish candle that opens below the low of the preceding candle but closes above its midpoint.
- Interpretation: This pattern indicates a potential bullish reversal in the market.
- Trend: It should be downtrend
- 4. Dark Cloud Cover Pattern:
- Explanation: This pattern comprises two consecutive candlesticks. The first is a bullish candle, followed by a bearish candle that opens above the previous candle’s high but closes below its midpoint.
- Interpretation: This pattern suggests a potential bearish reversal in the market.
- Trend: It should be uptrend
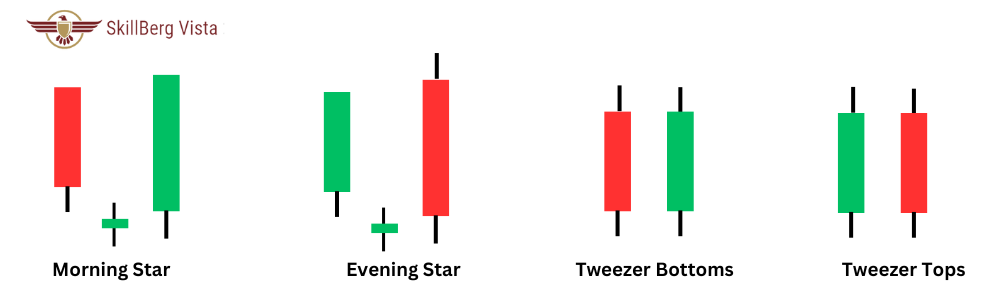
- 5. Morning Star Pattern:
- Explanation: This pattern is characterized by three candlesticks – a long bearish candle, a small bullish or bearish candle with a gap down, and a long bullish candle that engulfs the previous two.
- Interpretation: This pattern signals a potential bullish reversal.
- Trend: It should be downtrend
- 6. Evening Star Pattern:
- Explanation: This pattern consists of three candlesticks – a long bullish candle, a small bullish or bearish candle with a gap up, and a long bearish candle that engulfs the previous two.
- Interpretation: This pattern indicates a potential bearish reversal.
- Trend: It should be uptrend
- 7. Tweezer Bottoms:
- Explanation: Identified by two consecutive candlesticks with equal or nearly equal lows, signaling potential support at that level.
- Interpretation: This pattern suggests a potential bullish reversal.
- Trend: It should be downtrend
- 8. Tweezer Tops:
- Explanation: Recognized by two consecutive candlesticks with equal or nearly equal highs, suggesting potential resistance at that level.
- Interpretation: This pattern indicates a potential bearish reversal.
- Trend: It should be uptrend
These patterns are analytical tools, and it’s essential to consider various factors and incorporate them into a comprehensive technical analysis and risk management strategy for well-informed trading decisions.